Global carbon markets
Here's a look at carbon emissions and carbon trading trends worldwide.
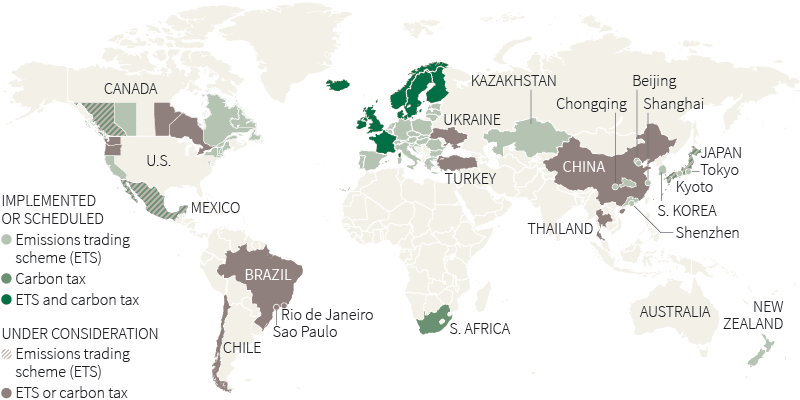
Putting a price on carbon
Around 40 countries and over 20 states, regions or cities have either set up or are planning to set up emissions trading schemes or carbon taxes. Together, they account for more than 22 percent of global emissions.
World's top emitters
Carbon dioxide (CO2) is the primary greenhouse gas emitted through human activities. According to Netherlands Environmental Assessment Agency and U.S. Dept. of Energy data, China overtook the United States as the world's top emitter in 2006.
CO2 emissions by country
Emissions from fossil fuel and cement production.
Global carbon emissions trend
How the world’s top carbon emitters compare.
Carbon credits
The Clean Development Mechanism (CDM), a function of the Kyoto Protocol, enables rich nations to meet their emission targets with credits which are used towards emissions-reduction projects in developing countries. The U.S. and countries that are not part of the Kyoto Protocol do not have credits.

How some carbon pricing schemes compare
Carbon prices vary between global emissions trading schemes due to differences in supply/demand dynamics, market structures and other issues. Among these four schemes alone, recently traded prices range between $3.56 and $11.90, with New Zealand Units (NZUs) the lowest and California prices the highest.

Sources: State and Trends of Carbon Pricing, World Bank Group; European Commission, Joint Research Centre (JRC)/PBL Netherlands Environmental Assessment Agency, Emission Database for Global Atmospheric Research (EDGAR), release version 4.2; Carbon Dioxide Information Analysis Center (CDIAC), Oak Ridge National Laboratory, U.S. Dept. of Energy; U.S. Census Bureau International Data Base; United Nations Population Information Network; United Nations Framework Convention on Climate Change (UNFCCC); Thomson Reuters Point Carbon; Reuters.
Graphics by Wen Foo
Updated: 17 November 2014